Dashboard: Kennzahlen und Widgets
Was das Dashboard tut
Das Dashboard ist der erste Bildschirm nach der Anmeldung. Oben sehen Sie eine Reihe von Kennzahlen. Darunter liegt ein Raster aus Widgets; jedes Widget ist ein Diagramm oder eine Tabelle aus Ihren eigenen Enydea-Daten. Sie können ein privates Dashboard für sich selbst führen und weitere für Ihr ganzes Team speichern.
Bevor Sie beginnen
- Ein Widget bleibt leer, bis die Funktion dahinter Daten hat. Ein leeres Widget zeigt Keine Daten verfügbar und den Hinweis Die Daten werden hier angezeigt, sobald sie konfiguriert sind.
- Die Widgets Website-Leads, Website-Daten und Einheitliches Tracking brauchen den Website-Tracker. Siehe Website-Tracking und Einwilligungseinstellungen.
- Die Widgets Anzeigen und Google Ads-Performance zählen Ihre Google-Ads-Kampagnen. Siehe Google Ads und Werbung.
- Das Widget Google Analytics braucht ein Google-Analytics-Konto. Ist eines verfügbar, erscheint oben im Dashboard eine Liste GA-Konto.
Die Kennzahlen ablesen
Die Kennzahlenreihe kann Beziehungen (Relations), Anrufe (Calls), Verkaufschancen (Opportunities), Website-Leads, Mailings, Social-Media-Kanäle, Aktionspunkte (Action Items), Formulareinträge und Videos zeigen. Eine Zahl erscheint nur, wenn sie größer als null ist; ein neues Konto zeigt daher wenige oder keine.
Beim ersten Öffnen
Bei einem neuen Konto öffnet sich der Einrichtungsassistent von selbst. Siehe Einrichtungsassistent. Sie können ihn auch später über das Zahnradmenü neben Bearbeitungsmodus öffnen.
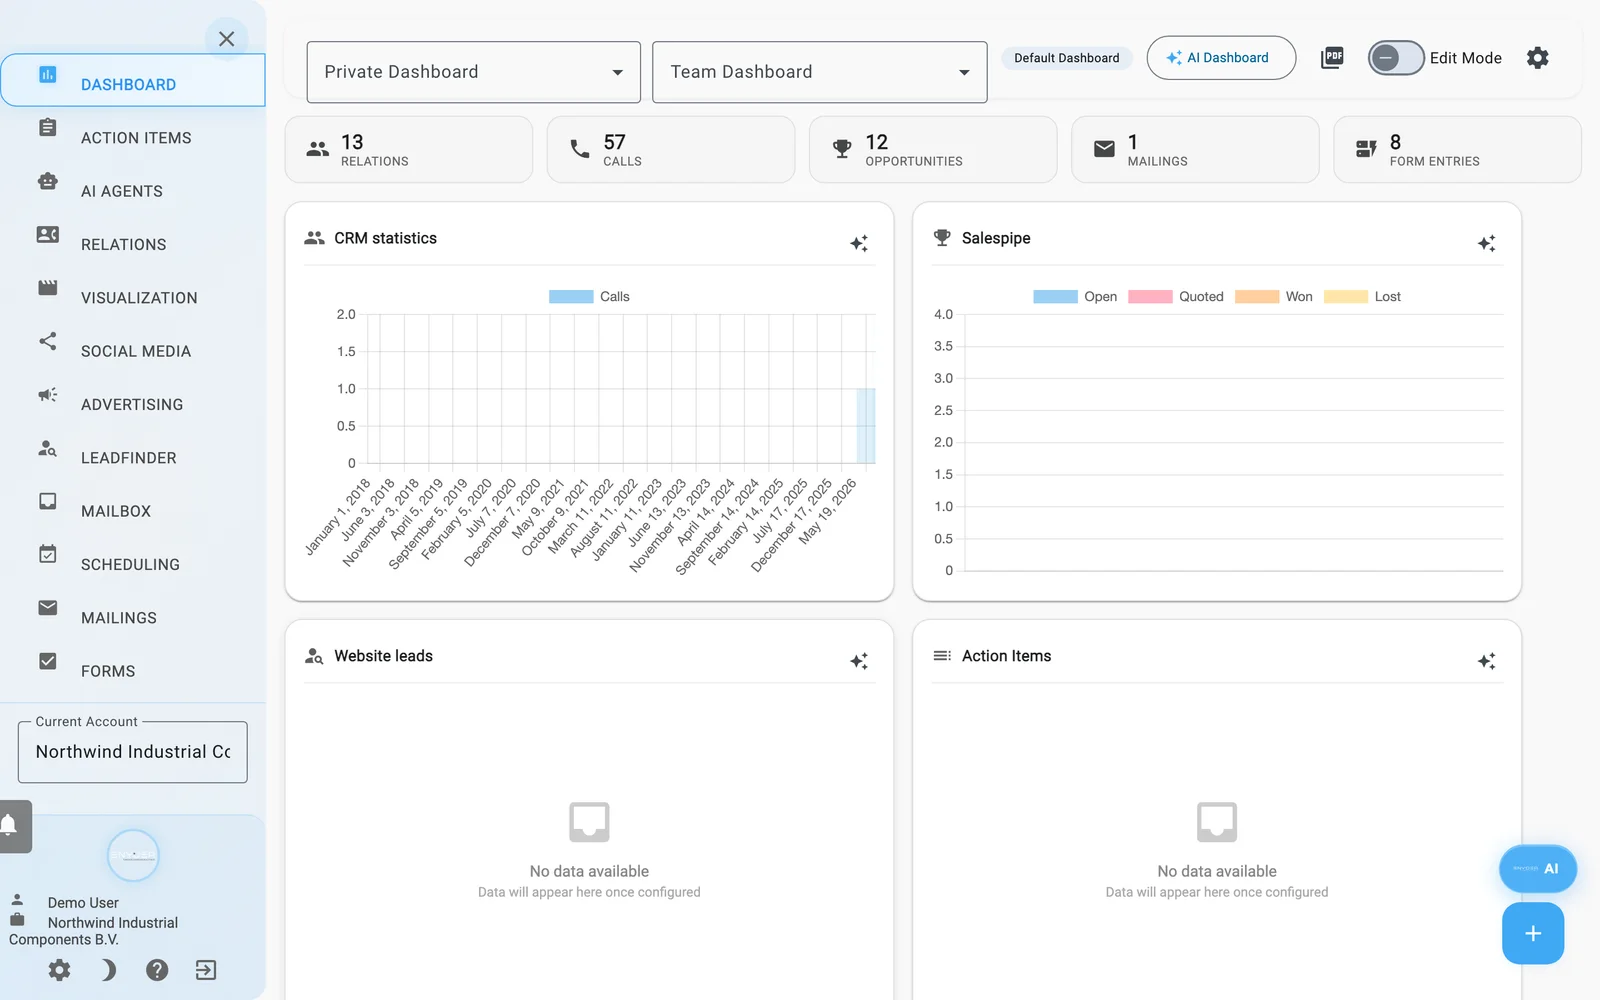
Das Dashboard eines neuen Kontos: Kennzahlenkacheln oben, Widgets darunter. Die Diagramme füllen sich mit Daten, während Sie arbeiten.
Die Karte Willkommen bei Enydea listet erste Schritte auf. Klicken Sie auf eine Zeile, um dorthin zu gelangen:
- Einrichtungsassistenten abschließen öffnet den Assistenten. Wenn Sie ihn abgeschlossen haben, lautet die Zeile Einrichtung abgeschlossen.
- Tracking einrichten öffnet Einstellungen (Settings).
- Ihre ersten Kunden hinzufügen öffnet Beziehungen. Siehe Beziehungen (CRM).
- Ihre erste E-Mail-Kampagne erstellen öffnet Mailings. Siehe Mailings und Kampagnen.
Klicken Sie auf das X der Karte, um sie zu schließen. Für Videos und Bilder nutzen Sie Visualisierung (Visualization) im Seitenmenü. Siehe Visualisierung.
Bis Sie ein Dashboard speichern, sehen Sie ein Standard-Dashboard mit acht Widgets: CRM-Statistiken, Vertriebspipeline, Website-Leads, Aktionspunkte, Social-Media-Nachrichten, Mailing-Statistiken, Anzeigen und Einheitliches Tracking.
Ein Widget hinzufügen
- Klicken Sie auf die schwebende Schaltfläche mit dem Tooltip Dashboard-Komponenten hinzufügen.
- Wählen Sie ein Widget aus der Liste.
- Öffnen Sie das Zahnradmenü und wählen Sie Speichern, um die Änderung zu behalten.
| Widget | Was es zeigt |
|---|---|
| Website-Leads | Tabelle der Unternehmen, die auf Ihrer Website erkannt wurden. Klicken Sie auf eine Zeile, um einen Lead-Dialog zu öffnen und das Unternehmen als Beziehung zu speichern. |
| Website-Daten | Karte der Website-Besuche. |
| Google Analytics | Diagramm aus Ihrem Google-Analytics-Konto. In den Widget-Einstellungen wählen Sie Dimension, Messwert und Zeitraum. |
| Mailing-Statistiken | Statistiken zu Ihren Mailings im gewählten Zeitraum. |
| Einheitliches Tracking | Website-Sitzungen und Seitenaufrufe sowie E-Mail-Öffnungen, E-Mail-Klicks und Formulareinsendungen. |
| CRM-Statistiken | Anrufe nach Datum, Beziehungen und Anrufe oder Beziehungen nach Status. |
| Social-Media-Nachrichten | Anzahl je verbundenem Typ von Social-Media-Kanal. |
| Aktionspunkte | Tabelle mit Titel, Priorität, Status und Fälligkeitsdatum. |
| Vertriebspipeline | Verkaufschancen nach Status, Typ oder Erfolgsquote. |
| Anzeigen | Google-Ads-Kampagnen nach Status. |
| Geplant | Geplante Mailings, Anzeigen und Artikel. |
| Formulareinsendungen | Neueste Formulareinträge mit Absender, Nachricht, Zeitpunkt und Status. |
| E-Mail-Aktivität | Anzahl der E-Mails je Ordner in Ihrem verbundenen Postfach. |
| Video Creator | Erstellte Videos pro Monat. |
| Content-Performance | Ihre Veröffentlichungen, gezählt nach Typ. |
| Google Ads-Performance | Budget von bis zu zehn aktiven oder pausierten Google-Ads-Kampagnen. |
Widgets ändern, verschieben oder entfernen
- Schalten Sie Bearbeitungsmodus ein.
- Ziehen Sie ein Widget an eine neue Stelle oder nutzen Sie die Pfeile nach oben und unten in seiner Kopfzeile.
- Klicken Sie auf das Zahnradsymbol eines Widgets, um Einstellungen des Dashboard-Elements zu öffnen. Sie können Größe, Farbschema, Diagrammtyp und Legende anzeigen ändern. Einige Widgets haben zusätzliche eigene Optionen.
- Klicken Sie auf Einstellungen speichern oder auf Element löschen, um das Widget zu entfernen.
- Öffnen Sie das Zahnradmenü neben Bearbeitungsmodus und wählen Sie Speichern.
Private und Team-Dashboards
Die Liste Privates Dashboard enthält Dashboards, die nur Sie öffnen können. Die Liste Team-Dashboard enthält Dashboards, die für Ihr Unternehmen gespeichert sind.
- Bauen Sie das gewünschte Dashboard.
- Öffnen Sie das Zahnradmenü. Aktivieren Sie Im Team verfügbar machen nur, wenn das ganze Team es sehen soll.
- Wählen Sie Als neu speichern und geben Sie einen Namen ein.
- Um ein Dashboard zu öffnen, wählen Sie es unter Privates Dashboard oder Team-Dashboard aus.
- Damit es als Erstes geöffnet wird, wählen Sie Als Standard festlegen.
Das Zahnradmenü enthält außerdem Löschen, Neu laden und Neues Dashboard hinzufügen.
KI-Dashboards
Klicken Sie auf KI-Dashboard und wählen Sie KI: Smart (alle Daten), KI: Anzeigen & Conversions, KI: CRM & Vertrieb oder KI: Inhalte & Social Media. Enydea baut aus den Daten, die Ihr Konto bereits hat, ein fertiges Dashboard. Das Abzeichen KI-Dashboard erscheint. Das Dashboard wird erst gespeichert, wenn Sie Als neu speichern wählen.
Die KI zu einem Widget fragen
Klicken Sie auf das Funkelsymbol in der Kopfzeile eines Widgets (KI zu diesem Widget fragen). Der KI-Assistent öffnet sich und sendet eine Frage zu diesem Widget, die nach Erkenntnissen und empfohlenen Maßnahmen fragt. Siehe KI-Assistent und KI-Agenten.
Als PDF exportieren
Klicken Sie auf das PDF-Symbol (Als PDF exportieren). Enydea wandelt das Raster des Dashboards in ein PDF um und lädt es mit dem Namen des Dashboards als Dateinamen herunter.
Hinweis: Wenn nichts heruntergeladen wird, klicken Sie erneut auf das Symbol. Die Schaltfläche zeigt keine Fehlermeldung.